RaspberryPi + MH-Z19C + BMP280 + GASで研究室の環境を可視化した話(後編)
本記事は二部構成の後編です。前編をまだお読みでない方はこちらから読めますので、お急ぎでなければお先に前編をどうぞ。
さて後編です。引き続きM1のYukimuraです。
前編ではセンサーを用いて環境情報の取得、そしてtkinterを用いたGUIアプリケーションの作成を行いました。本編では、GASを用いてブラウザから環境情報を閲覧できるようにしていきます。ゴールは、GASでHTMLを作成してグラフを描画することです。
全体像
複雑になってきたのでシステムの全体のイメージを書いておきます。
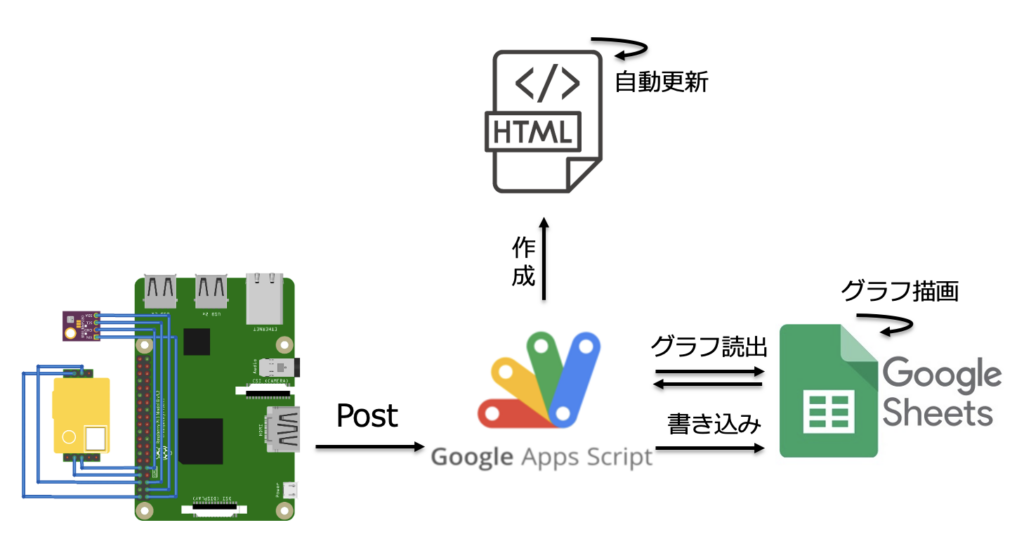
作成、とか書いてますがHTML(に書かれたJS)の中でGASの関数を利用しているということです。かんたんのため。
こう見るとGASってホント有能ですね。Postされたデータの書き込みとグラフの読み出しとHTMLサービスのバックエンドまでやってくれます。
データのPost
データをインターネットから見るには一般にサーバーにアップロードしないといけないです(今更感)。ラズパイでサーバーを立てて、外から叩けるようにするという手もあるのですが、研究室内に自分の責任で外から叩けるサーバーを立てたくないので、上で紹介したとおり、今回はGAS(Google Apps Script)+スプレッドシートをデータベースサーバーとして使います。
流れとしては、ラズパイからPost->GASが受け取ってデータを処理->スプレッドシートに書き込み、という形になります。
早速GASでPostを受け取るスクリプトを書きましょう。
コードは以下
function doPost(e) {
  var ss       = SpreadsheetApp.getActiveSpreadsheet();
  var sheet    = ss.getSheetByName('シート1');
  Logger.log(e.parameter.co2);
  sheet.appendRow([e.parameter.co2, e.parameter.humi,e.parameter.temp,e.parameter.pres,new Date()]);
}
書けたら、デプロイをします。

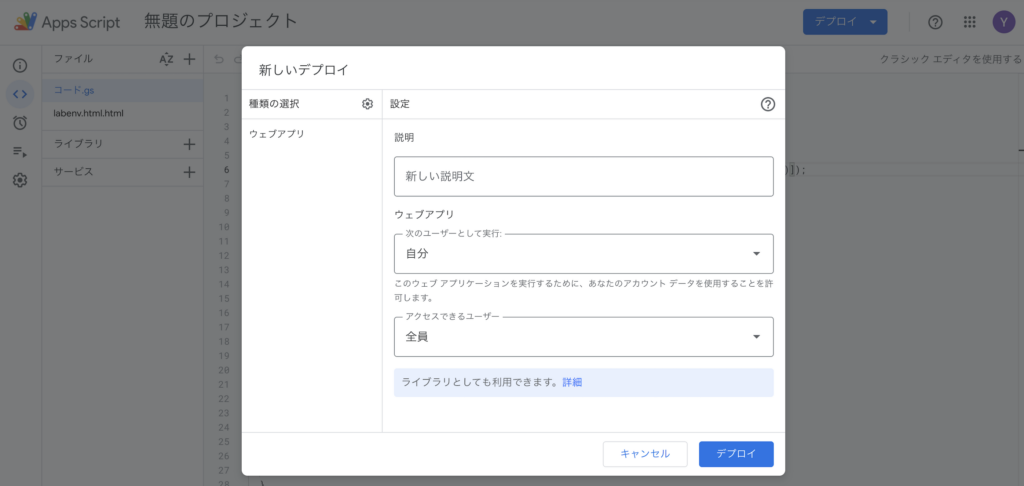
するとURLが発行されるので、これを控えておきます。
続いてラズパイに戻って、GASにPostするコードを追記します。
import requests

URL="https://script.google.com/macros/XXXXXXXXXXXXX/exec"
param={'co2':co2,'humi':humi,'temp':temp,'pres':pres}
res=requests.post(url,params=param)
これで、各値が下図のようにスプレッドシートに書き込まれていきます。
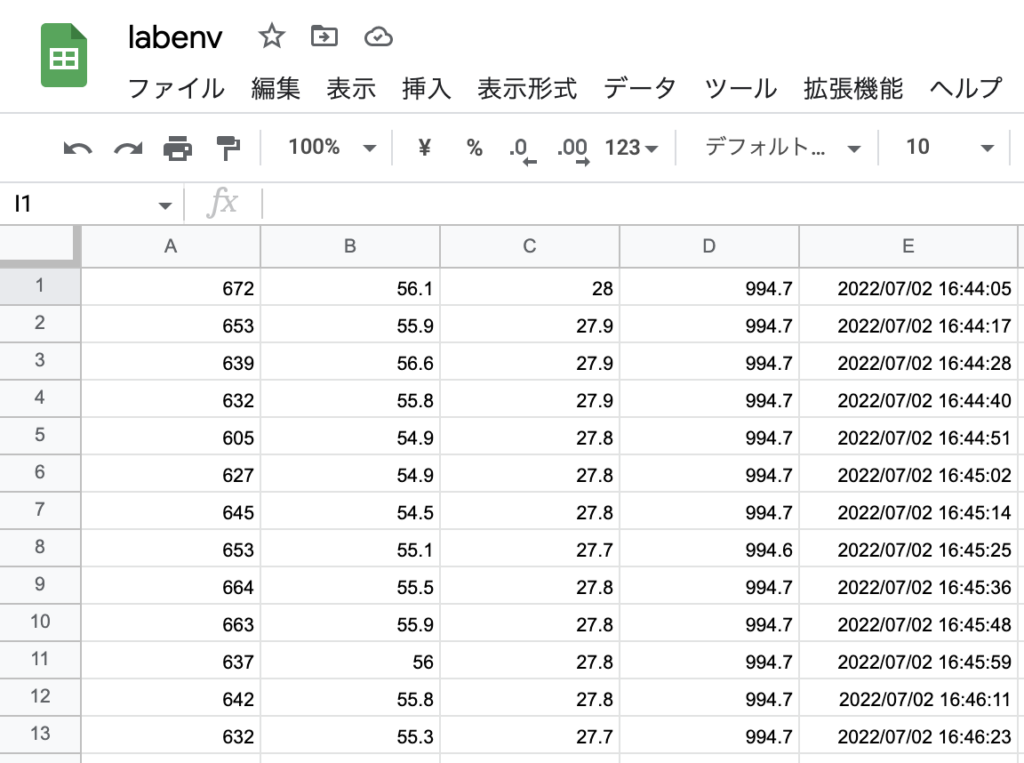
このデータを使ってグラフを作ります。
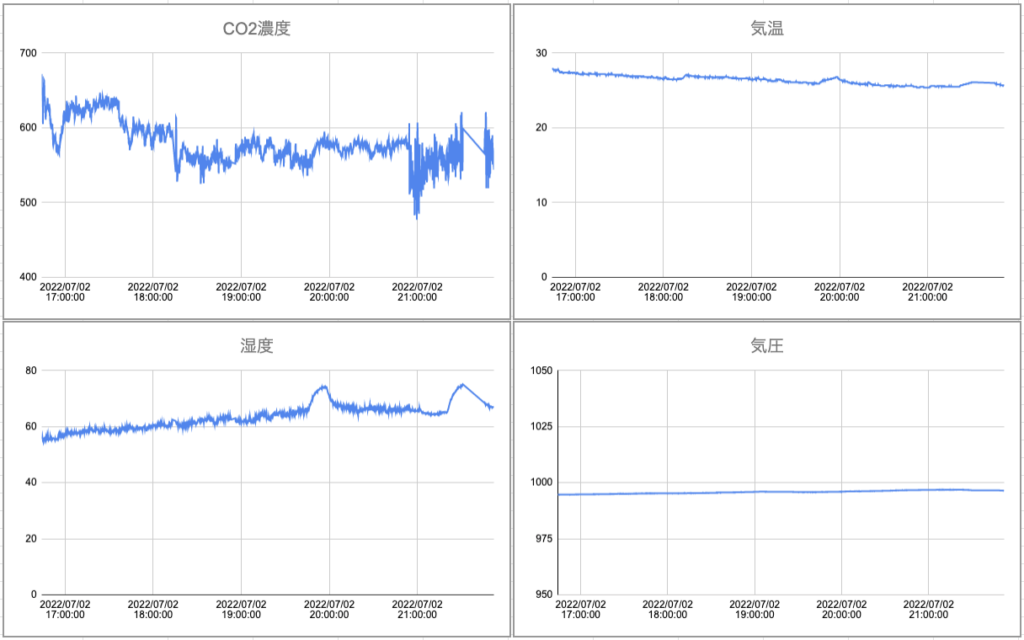
HTMLで描画
さて、上までで作ったグラフをHTMLに乗せていきます。こちらもデプロイするサービスは本来何でも良いのですが、折角なのでGASのHTMLサービスを使っていこうと思います。
ここから先はRCCアドカレ2019「27日目:GASのHTML Serviceでスプレッドシート内のグラフを使用する(Base64文字列渡し)」を参考にしました。
詳細は参考元の記事を参照ください。
グラフの描画はスプレッドシートの「グラフを公開」機能でも良かったのですが、更新がめちゃくちゃ遅いので、今回は上記記事で紹介されているBase64渡しの手法を採択しました。
GASのコードは以下
function doGet(e) {
  return HtmlService.createTemplateFromFile("labenv").evaluate()
    .setTitle('Graph')
    .addMetaTag('viewport', 'width=device-width, initial-scale=1')
    .setXFrameOptionsMode(HtmlService.XFrameOptionsMode.ALLOWALL);
}
function getScriptUrl() {
  var url = ScriptApp.getService().getUrl();
  return url;
}
function openShtByName(name){
  try{
    const ss = SpreadsheetApp.getActiveSpreadsheet(); //アクティブスプレッドシートを開く->ss
    const sss = ss.getSheetByName(name);              //nameという名前のシートを開く->sss
    return sss;
  }catch(e){
    Logger.log( e );
    return -1;
  }
}

function getChartBlob(sname,gnum){
  var sht = openShtByName(sname);
  var chart = sht.getCharts()[gnum]; // そのシートにある1つ目のグラフを取得 添え字を変えれば2つ目,3つ目...に変更可
  return (Utilities.base64Encode((chart.getBlob().getBytes())));
}
htmlのコードはこちら
<!DOCTYPE html>
<html>
  <head>
    <script>
      function showGraph(sname,gnum,id){
        try{
          let callbk = (data) =>{ ElmId(id).src = "data:image/png;base64," + data; }
          google.script.run.withSuccessHandler(callbk).getChartBlob(sname,gnum);
        }catch(e){
          alert("グラフ表示に失敗しました:\n" + e);
        }
      }

      function ElmId(id){
        return document.getElementById(id);
      };
      function showGraphs(){
        showGraph('シート1',0,'gr1');
        showGraph('シート1',1,'gr2');
        showGraph('シート1',2,'gr3');
        showGraph('シート1',3,'gr4');
        showGraph('1h',0,'1hgr1');
        showGraph('1h',1,'1hgr2');
        showGraph('1h',2,'1hgr3');
        showGraph('1h',3,'1hgr4');
        showGraph('24h',0,'24hgr1');
        showGraph('24h',1,'24hgr2');
        showGraph('24h',2,'24hgr3');
        showGraph('24h',3,'24hgr4');
        showGraph('その他',0,'otgr1');
        showGraph('その他',1,'otgr2');
      };
      window.addEventListener('load',showGraphs());
      window.addEventListener('load',function(){setInterval('showGraphs()',10000);});

    </script>
    <base target="_top">
    <style>
      section{
        display:    block;
        width:      100%;
        max-width:  100vw;
        text-align: center;
      }
      .area {
  margin: auto;
  flex-wrap: wrap;
  display: flex;
  justify-content: center;
}

.tab_class {
  width: calc(100%/4);
  height: 50px;
  background-color: darkgrey;
  line-height: 50px;
  font-size: 15px;
  text-align: center;
  display: block;
  float: left;
  order: -1;
}

input[name="tab_name"] {
  display: none;
}

input:checked + .tab_class {
  background-color: cadetblue;
  color: aliceblue;
}

.content_class {
  display: none;
  justify-content: center;
}

input:checked + .tab_class + .content_class {
  display: block;
  justify-content: center;
}
p {
  display: flex;
  justify-content: center;
}

    </style>
    <meta http-equiv="Pragma" content="no-cache">
    <meta http-equiv="Cache-Control" content="no-cache">
    <meta http-equiv="Expires" content="0">
  </head>
  <body>
    <section>
      <h1>Cysec研環境情報システム AMATERAS</h1>
      <div class="area">
        <input type="radio" name="tab_name" id="tab1" checked>
        <label class="tab_class" for="tab1">全期間</label>
          <div class="content_class">
            <p><img id="gr1" style="width:50%;max-width:640px;" alt="loading..."><img id="gr2" style="width:50%;max-width:640px;" alt="loading..."></p>
            <p><img id="gr3" style="width:50%;max-width:640px;" alt="loading..."><img id="gr4" style="width:50%;max-width:640px;" alt="loading..."></p>
          </div>
        <input type="radio" name="tab_name" id="tab2" >
        <label class="tab_class" for="tab2">直近1時間</label>
        <div class="content_class">
          <p><img id="1hgr1" style="width:50%;max-width:640px;" alt="loading..."><img id="1hgr2" style="width:50%;max-width:640px;" alt="loading..."></p>
          <p><img id="1hgr3" style="width:50%;max-width:640px;" alt="loading..."><img id="1hgr4" style="width:50%;max-width:640px;" alt="loading..."></p>
        </div>
        <input type="radio" name="tab_name" id="tab3" >
        <label class="tab_class" for="tab3">直近24時間</label>
        <div class="content_class">
          <p><img id="24hgr1" style="width:50%;max-width:640px;" alt="loading..."><img id="24hgr2" style="width:50%;max-width:640px;" alt="loading..."></p>
          <p><img id="24hgr3" style="width:50%;max-width:640px;" alt="loading..."><img id="24hgr4" style="width:50%;max-width:640px;" alt="loading..."></p>
        </div>
        <input type="radio" name="tab_name" id="tab4" >
        <label class="tab_class" for="tab4">その他</label>
        <div class="content_class" id="tab4div">
          <p><img id="otgr1" style="width:50%;max-width:640px;" alt="loading..."><img id="otgr2" style="width:50%;max-width:640px;" alt="loading..."></p>
        </div>
        </div>
    </section>
  </body>
</html>
(html/js/css書くの苦手なので超雑ですが許してください)
工夫した点として、10秒ごとにグラフが自動更新されるようにしました(window.addEventListener(‘load’,function(){setInterval(‘showGraphs()’,10000);});のとこ)。これでほっといても更新されていくっていう算段です。
これをデプロイして、今度こそ完成です。
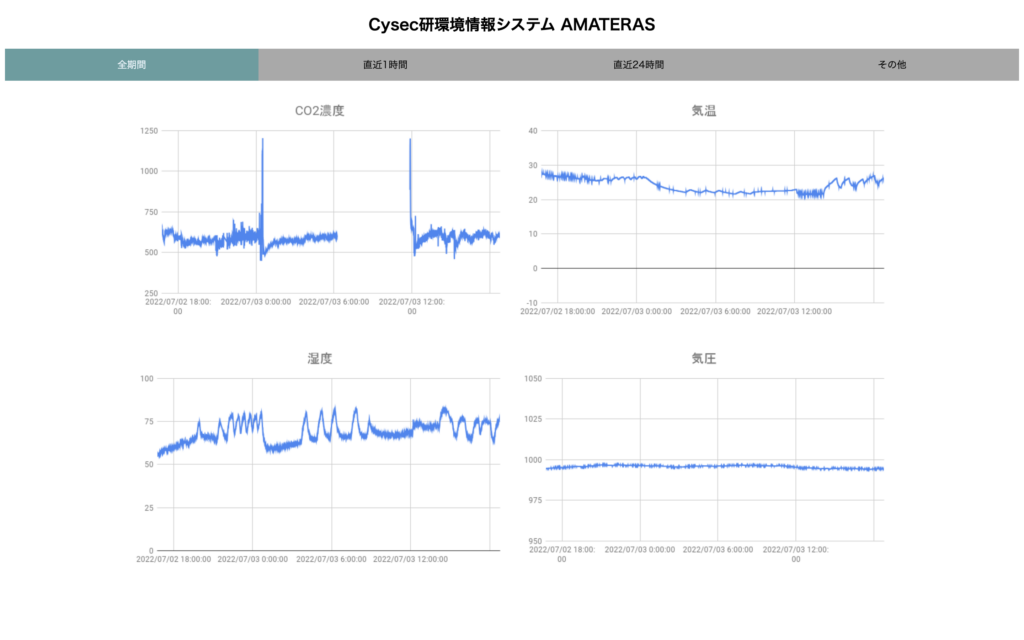
完成品はこちら(画像をタップするとページに飛びます)(停止していたらごめんなさい)
「Automatic Measurement Acquisition, The Environment Research and Analysys System」の頭文字を取って「AMATERAS」と命名しました。太陽神にあやかりましたが、夏は少しくらい岩戸にお隠れになってもらったほうが都合が良いかも知れません。アイデアをくれたB4の星名くんありがとう。
さて何はともあれ、これで家からでも研究室の環境情報が取得できます。一安心。
おわりに
というわけで今回は趣向を変えてIoTデバイスの作成をしました。
これから暑くなってきますし、諸々の兼ね合いで換気もしないといけないってことで、密閉して冷房ガンガンにするわけにもいかないので環境の把握は大事ですよね!!
手元にサーバを立てなくてもこれだけのものができるというのは、結構私としては感動でした。
何でもできる上原研では、IoTもできるんだぞということで、これからも面白いものを作っていこうと思います。
本業の研究の進捗が1ミリも出てない気がしますが、がんばるます。だいじょぶます。
(文責:2022年度M1 木村 悠生)
